
How to See Flipbook Analytics in Google Analytics
If you have already connected your flipbook to Google Analytics 4, you can view much more than total traffic. With the right report setup, you can see which flipbook titles are opened most often, which pages readers view, and how long they stay on each page or spread.
This guide shows a simple way to turn the raw events into reports that are easy to read and useful in day-to-day work.
What Your Flipbook Sends to GA4
Instant Flipbook sends three analytics events to Google Analytics 4:
flipbook_openedwhen a flipbook is opened.flipbook_page_viewwhen a page or spread becomes visible.flipbook_page_timewhen the reader leaves a page or spread, with the time spent sent as the event value in seconds.
Each event also includes the flipbook title and the page number, so you can group your reports by title first and then drill down into page-level detail.
Step 1: Create the Custom Dimensions Once
Before Google Analytics can show your flipbook title and page number in reports, create two custom dimensions:
- Open Google Analytics 4.
- Go to Admin → Custom definitions.
- Click Create custom dimension.
- Create one event-scoped dimension for
event_labeland name it something like Flipbook Title. - Create another event-scoped dimension for
page_numberand name it something like Page Number.
You only need to do this once. After that, these fields become available in explorations and custom reports. If you just created them, give GA4 some time to populate the data.
Step 2: Confirm the Events Are Coming In
To quickly confirm that tracking is working, open the standard events report:
- Go to Reports → Engagement → Events.
- Look for the three events:
flipbook_opened,flipbook_page_view, andflipbook_page_time.
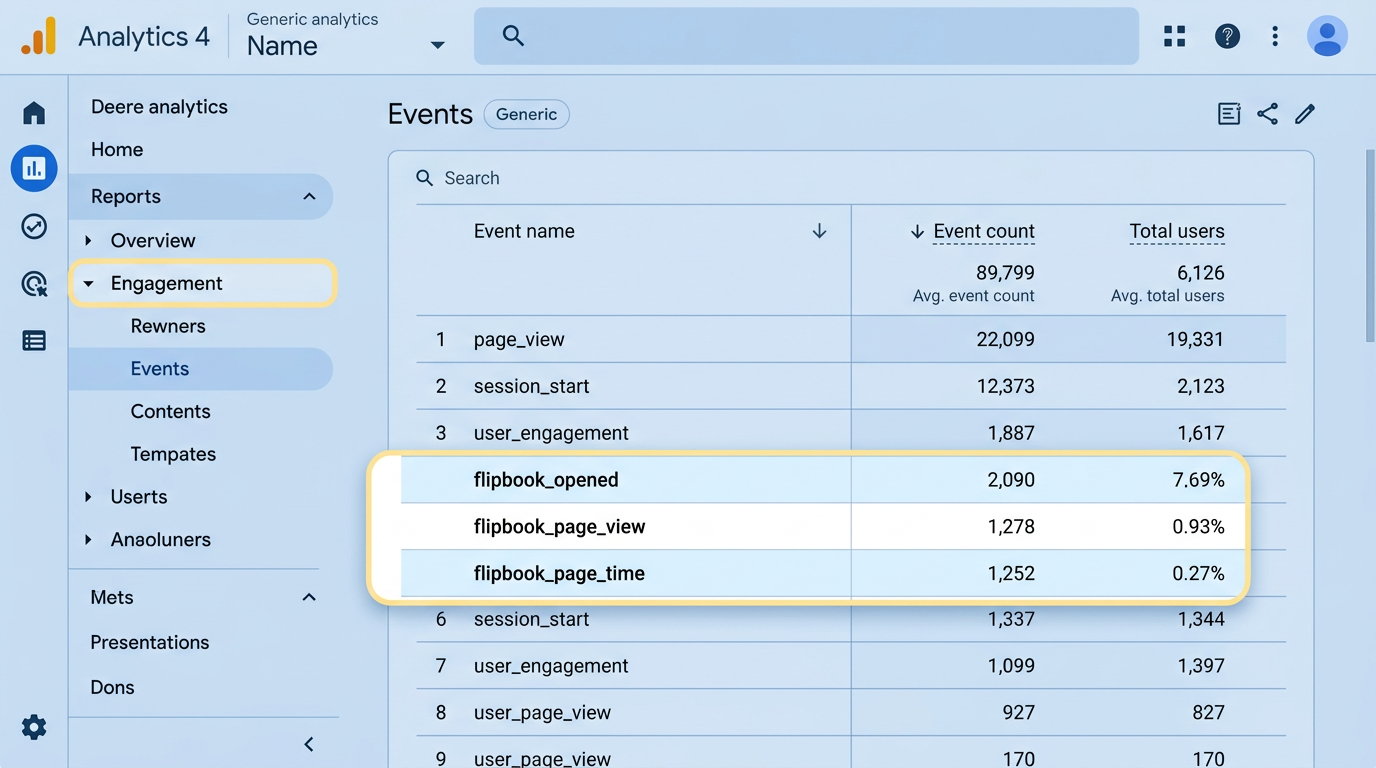
If these events appear in the list, the data is arriving correctly and you can now build a more user-friendly view in Explore.
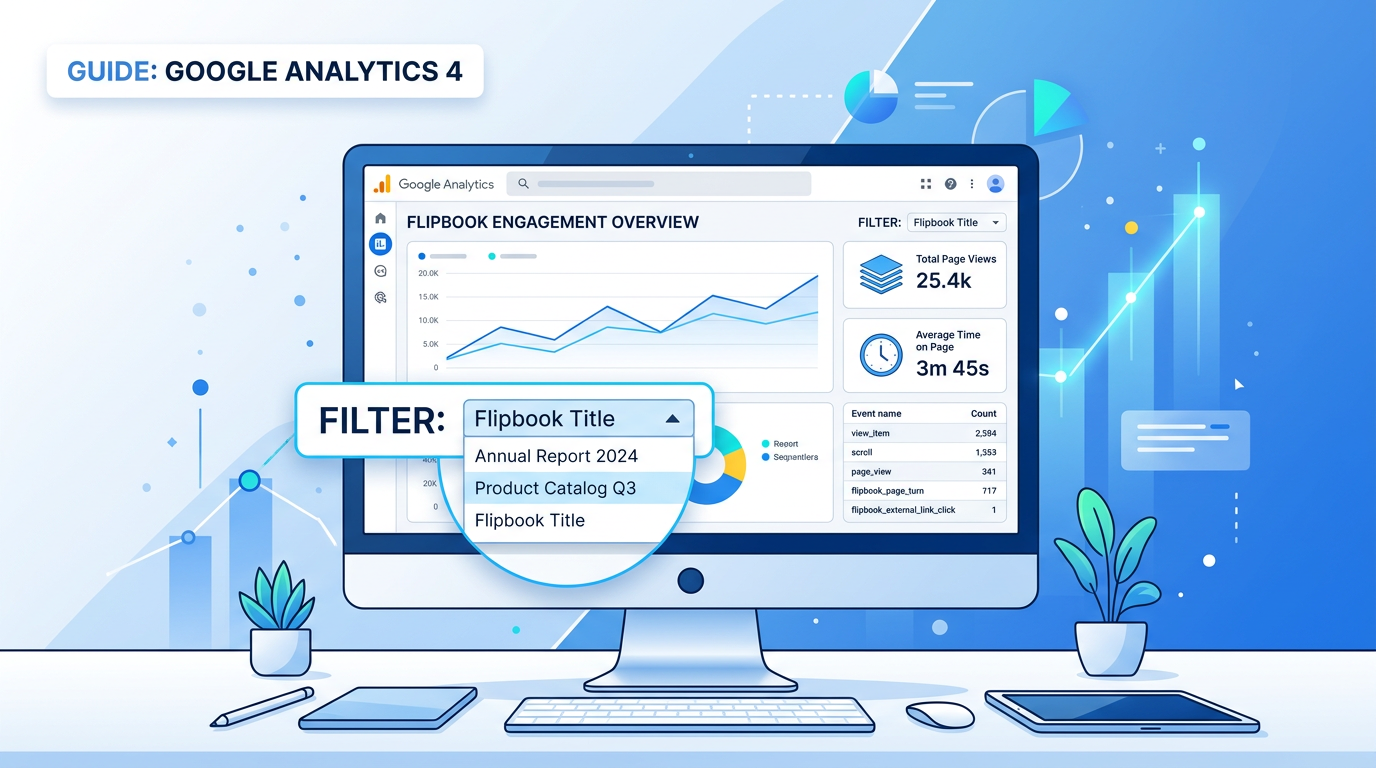
Step 3: Build a Report That Shows Stats Per Flipbook Title
This is the easiest way to see all of your flipbooks in one place.
- Open Explore and create a Free form exploration.
- Add the dimension you created for the title, for example Flipbook Title.
- Add the metric Event count.
- Set Rows to Flipbook Title.
- Add a filter where Event name equals
flipbook_opened.
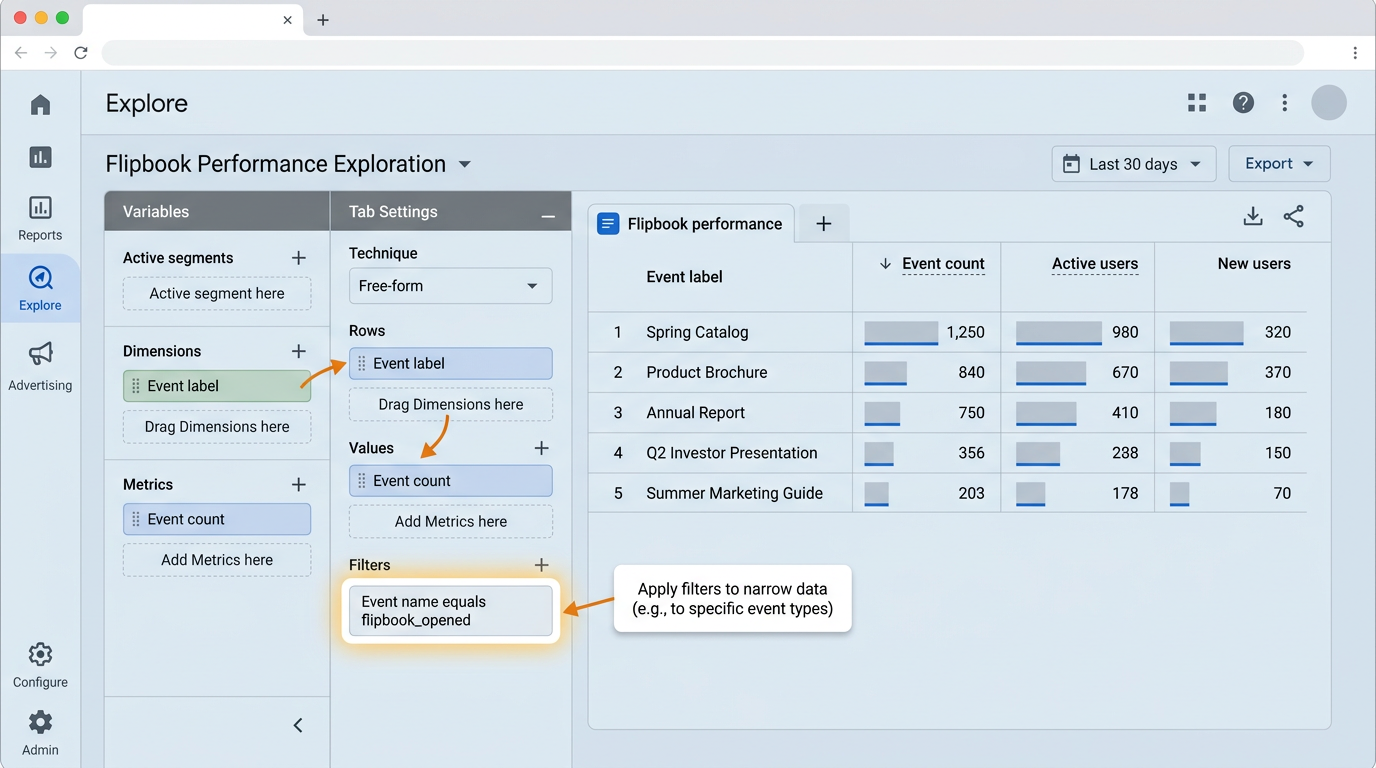
This creates a clean table showing how many times each flipbook was opened. Think of this as your top-level flipbook performance report.
Step 4: Drill Into One Flipbook and See Page Performance
Once you know which flipbook title you want to inspect, create another exploration tab and filter it to that single title.
- Create a new Free form tab in Explore.
- Add the dimensions Flipbook Title and Page Number.
- Add the metrics Event count and Average event value.
- Set Rows to Page Number.
- Add a filter where Flipbook Title equals the title you want to analyze.
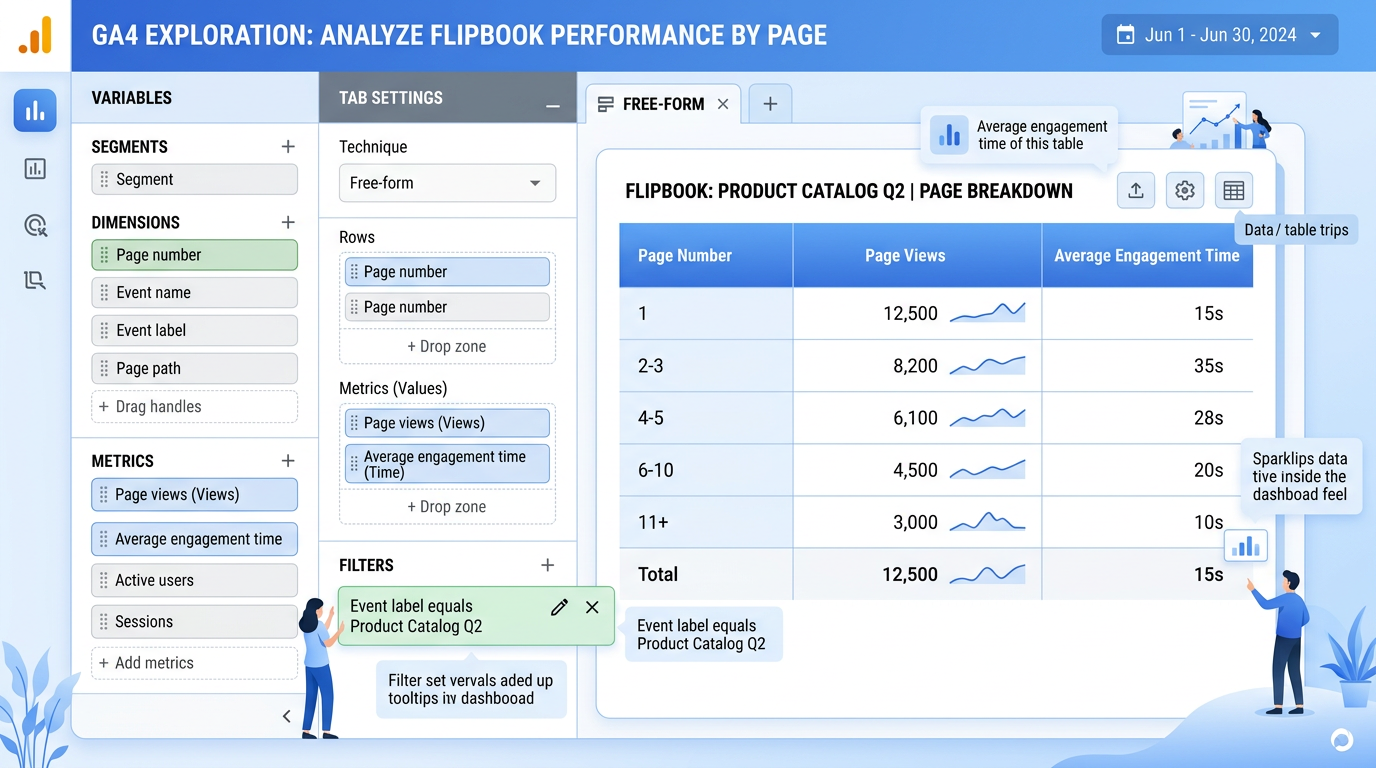
To keep the report easy to read, use separate tabs for the two page-level questions below:
- Page views by page: filter Event name to
flipbook_page_viewand use Event count. - Time spent by page: filter Event name to
flipbook_page_timeand use Average event value or Total event value.
In most cases, Average event value is the easiest metric for understanding how long readers stay on each page. Because the value is sent in seconds, the numbers are straightforward to interpret.
Recommended Simple Setup
If you want a clean, easy-to-use analytics workspace, create these three Explore tabs and save them:
- Flipbook Opens: grouped by Flipbook Title, filtered to
flipbook_opened. - Page Views by Flipbook: grouped by Page Number, filtered to one title and
flipbook_page_view. - Time on Page by Flipbook: grouped by Page Number, filtered to one title and
flipbook_page_time.
That gives you the exact flow most users want: first see all flipbooks by title, then choose one, then review page-by-page engagement.
Troubleshooting
- If you can see the events but not the title or page fields, the custom dimensions probably have not been created yet.
- If a report is empty right after setup, wait a little while and check again. GA4 can take time to expose newly registered dimensions in reports.
- If you want more accurate comparisons, keep the same date range across all exploration tabs.
Once this is set up, Google Analytics becomes a much more user-friendly dashboard for your flipbooks instead of just a list of raw events.
Featured Articles
- Uploading a Flipbook to Your Website
- Flip Book Embed Code Generator
- How to Embed Flipbook on WordPress
- Benefits of Using a Flipbook
Businesses use Instant Flipbook


